Plotting Expression Profiles Data Analysis for Network Inference
By Güngör Budak
- 3 minutes read - 530 wordsFor in silico data network inference I decided to develop a script because the existing tools have bugs and they are not compatible with the data. At the same time, I will try to report bugs and the compatibility issues to developers.
in silico data has 660 experiment results of 20 antibodies, 4 kinds of stimuli and 3 kinds of inhibitors. Antibodies are treated with a stimulus, say at t_0 and in the case of inhibitors, say at t_i, antibodies are pre-incubated for some time (t_pre) and then, treated with a stimulus. So, the relation is:
t_i = t_0 - t_pre
The causal edges between nodes (antibodies) in the network will be determined by the expression profile of any node, in the presence of intervention on parent node. That is, when AB12 is inhibited, if AB1 expression decreases over time, then we can draw (excitatory) edge between AB12 and AB1.
In the script for network inference, right now there are two functions: midasReader and dataPlotter.
midasReader takes MIDAS file path and child node as the arguments, reads MIDAS file into a data frame and then according to properties of data, it returns a data frame that can be used to plot expression profile graphs. Child node argument is used to get only related (expression of child node in different cases) data from whole dataset. In in silico data case, each experiment is done three times for each treatment (there are 20 different treatments) and each time point (there are 11 time points). So, there are 220 experiments, which are returned by midasReader in a data frame in three columns (treatments, timePoints, data).
Since there are three data values for each case, I took average of those for this time. But there must be more accurate ways of using them. I have to work on that more.
After the data frame is created, dataPlotter, gets three arguments to plot the graph of expression profiles, First argument is the data frame. The others are no intervention and intervention conditions (i.e. hiLIG1 and INH1+hiLIG1). The relations of inhibitors, stimuli and their targets are given in the table below.
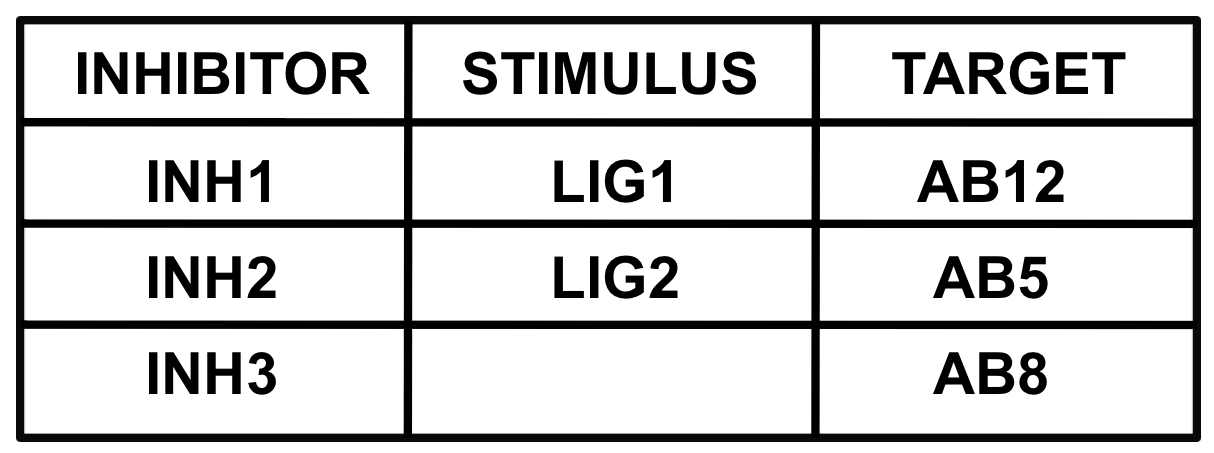
Relationship between ligands, stimuli and targets for the in silico model, Taken from: https://www.synapse.org/#!Wiki:syn1720047/ENTITY/56061
So, when I give hiLIG1 and INH1+hiLIG1 as input and select the child node as AB1, I’m looking for relation between AB12 and AB1. Below, there is the graph for this case. I ran the script as shown below on terminal:
1bigcat@bigcat-shut-01:~/gungor/netinf$ ./netInf.R MD_insilico.csv AB1 hiLIG1 INH1+hiLIG1
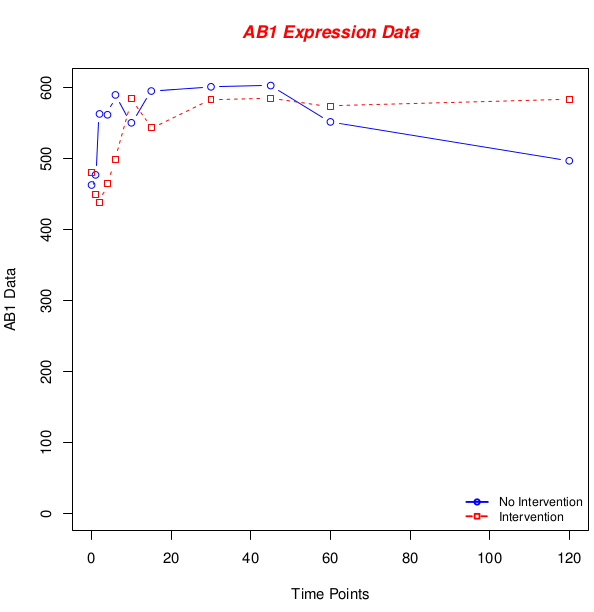
In this graph, there is no clear difference between expression profiles, so we might not tell if there is a relation looking at this graph. More accurate analyses should be done. After being sure about the accuracy of these analyses, I will move on constructing networks using these graphs.
Another example which shows clear difference is below:
1bigcat@bigcat-shut-01:~/gungor/netinf$ ./netInf.R MD_insilico.csv AB1 loLIG1 INH1+loLIG1
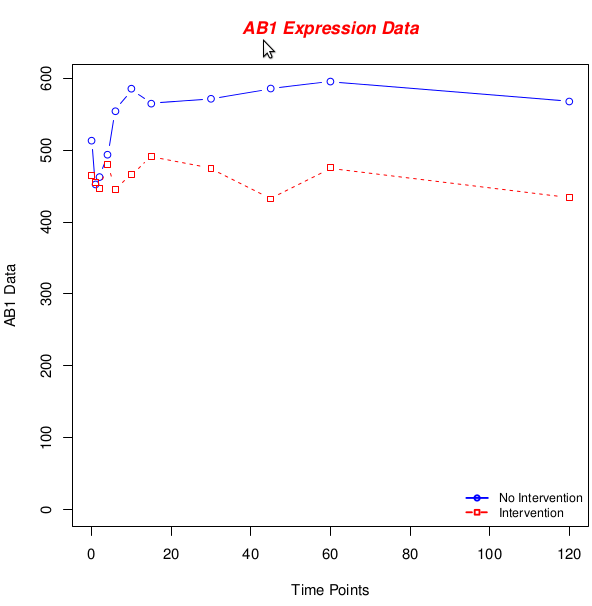
Here, we can say intervention on AB12 in the case of (INH1+loLIG1) causes a descrease in AB1 expression so in low amount of stimulus, AB12 is triggering AB1 amount.
However, as I mentioned above, the analysis is not efficient and should be developed. And then, more accurate results can be obtained.