In silico Network Inference Last Improvements and Visualization of Result in Cytoscape
By Güngör Budak
- 2 minutes read - 225 wordsI’m almost done with the analysis of in silico data, although I need to decide if I need further analysis with the inhibiting parent nodes in the network. Last, I couldn’t filter out duplicate edges, which were scored differently. Now, with some improvements in the script, low scores duplicates are filtered and there is a better final list of edges which is ready to be visualized.
I also tried visualizing it on Cytoscape. This is not required in the challenge but better to have to see the result. Below, there is a visualization of the result. It has colored edges and shaped edge ends (red and T-shaped edge is inhibiting, green and arrow-shaped edge is activating) according to type of interaction. Each edge has a score and it is indicated numerically and visually by having different thickness. The thicker the edge, the larger score it has relatively.
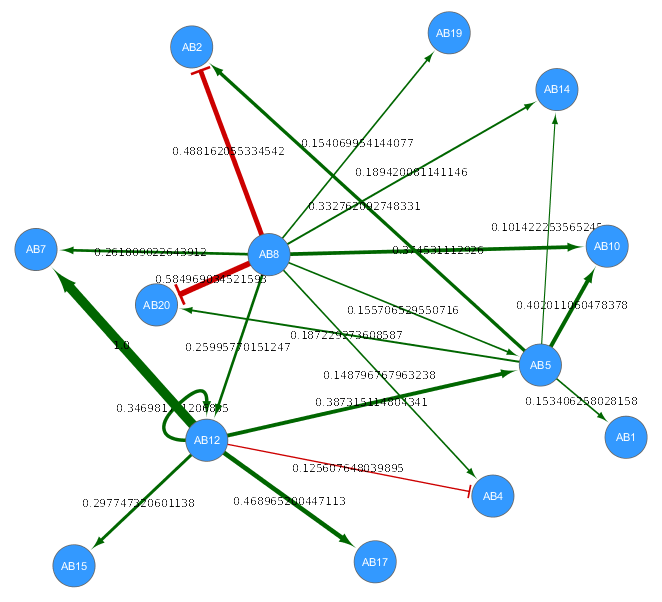
In silico data-derived network from HPN-DREAM Challenge. Click on the network to enlarge it.
I will decide to do further analysis for in silico part according to the rank in the Leaderboard 1B. I have already started modifying the script to read and process experimental data. I will define relations between inhibitors, stimuli and antibodies for experimental data as I did for in silico data, then infer the network using the same script as in in silico part.