Plotting Expression Curves for Experimental Data
By Güngör Budak
- 3 minutes read - 584 wordsAs I can plot expression curves for in silico data. I moved on experimental data which is more complex and larger. This data is the result of RPPA experiments on different breast cancer cell lines and it includes protein abundance measurements for about 45 phophoproteins. These phosphoproteins are treated with different inhibitors and stimuli and by comparing their expressions, I will try to infer relations between them.
Before moving on inferring part, I want to have a script that can plot the graphs so that I can see particular results for specific cases. For that, I used the same script as in in silico part but I has to modify it a lot to handle experimental data. I mentioned some of my progress on this in the previous post. Now, I have completed it by ordering the data according to pre-defined fashion, handling duplicates (taking average of them), putting NAs for the missing data points and estimating data points which are in the middle (taking average of neighboring data points in the series). I do this estimation because they are not many and most of them are missing only one point. And in this way, I’m able to have more edges in networks.
Then, the network is inferred and the edges are scored. Since second and third inhibitors act on two proteins, before showing the results, the script splits those with two targets and keeps the scores and relations the same. If there is already an edge after the split, based on their score, the one with higher score is written in the result.
In this inference, I consider each inhibitor with its target(s) and construct relation between its target(s) and phophoproteins in the files. And these targets are actually in the data but since they are given in unphophorylated forms, they are not exactly the same as in the ones in the data. For example, “GSK690693” is given as “AKT inhibitor” and when I use it for inferring networks, I find relations between “AKT” and other phophoproteins. “AKT” is present in the data in several phosphorylated forms such as: “AKT_pS473” and “AKT_pT308”. So, I have a relation between “AKT” and “AKT_pS473”, for example. This is not I want and not what it’s asked because in the network I should have only phosphoproteins from the files. Therefore, I might do this: I can duplicate each edge with “AKT” and name them as the forms of AKT present in the file, which means I will assume that “GSK690693” inhibits all phosphorylated forms of AKT. This is true for “MEK”, too. I haven’t seen the other inhibited proteins “FGFR1” and “FGFR3” in the data, which is strange. I will go over it later.
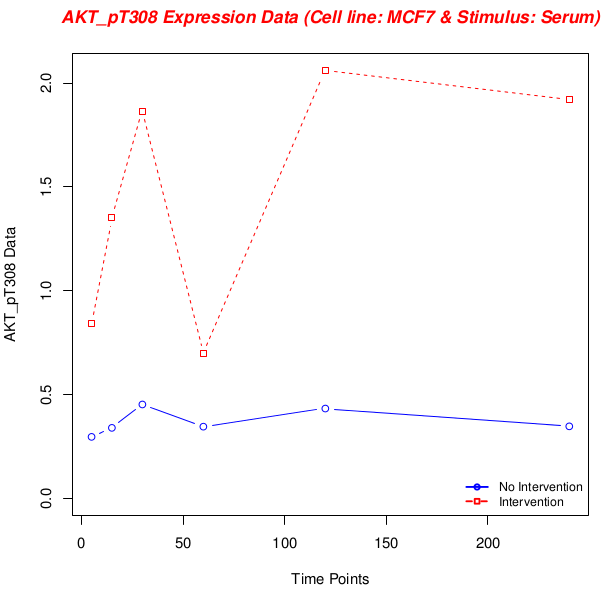
Above, there is a plot from experimental data. Cell line is “MCF7” and stimulus is “Serum”. The antibody being investigated is “AKT_pT308”. The invervention condition is “Serum__GSK690693”, which means I’m investigating relation of “AKT” forms on themselves. This plot shows a confident result of inhibiting relation. So we can conclude that “AKT” forms inhibit themselves. Because, under inhibition, its expression increases.
It was run using these parameters:
1bigcat@bigcat-shut-01:~/gungor/netinf$ ./netInfPlotter_experimental.R MCF7 AKT_pT308 Serum Serum__GSK690693
Actually, there are not many things I can do anymore because I’m leaving in two weeks and also the challenge will end soon. In the following days, I will try to learn more on statistics and try to improve that part of network inference. I will also try to visualize the networks in Cytoscape and write another post on it.