Network Visualization Using Cytoscape
By Güngör Budak
- 3 minutes read - 451 wordsCytoscape is a nice tool to visualize network for better understanding and delivery. I used it for in silico data network visualization and the result was really pretty. Now, I have networks constructed using experimental data from HPN-DREAM Challenge.
In this post, I want to demonstrate how to visualize a network with scores. I’m using Cytoscape 2.8 on Ubuntu 12.
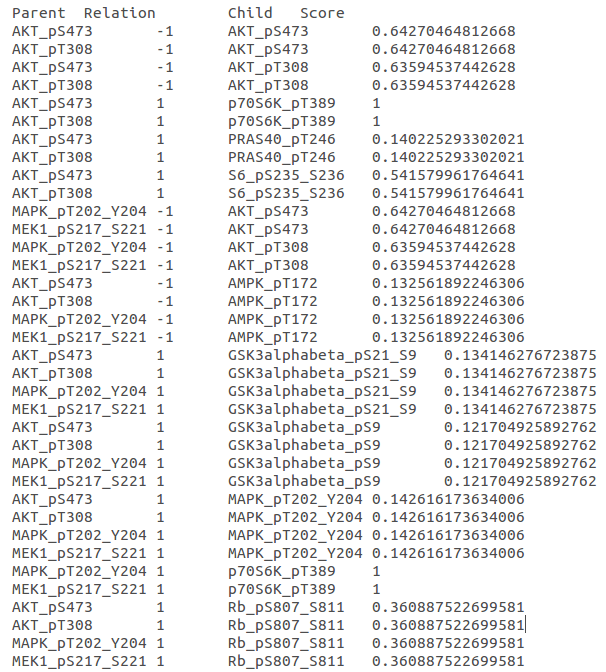
First, the network will be read from a SIF file which is default format of Cytoscape for networks. But, to have scores of edges in the network, this SIF file will be different. This SIF file has 4 columns: parent node, relation, child node and score. These columns will be named not to confuse us during visualization. Below, you can find an example.
Next, by clicking on “File” -> “Import” -> “Network from Table (Text/MS Excel)…”, we will open a window to read data properly. On the window, we will open additional options by clicking on “Show Text File Import Options”, then “Transfer first line as attribute names…”. This option will help use column names in the network. Next, we will define source (parent), interaction (relation) and target (child) and also click on ‘‘Score" column to have it as an edge attribute. After all this, we should have this kind of selections:
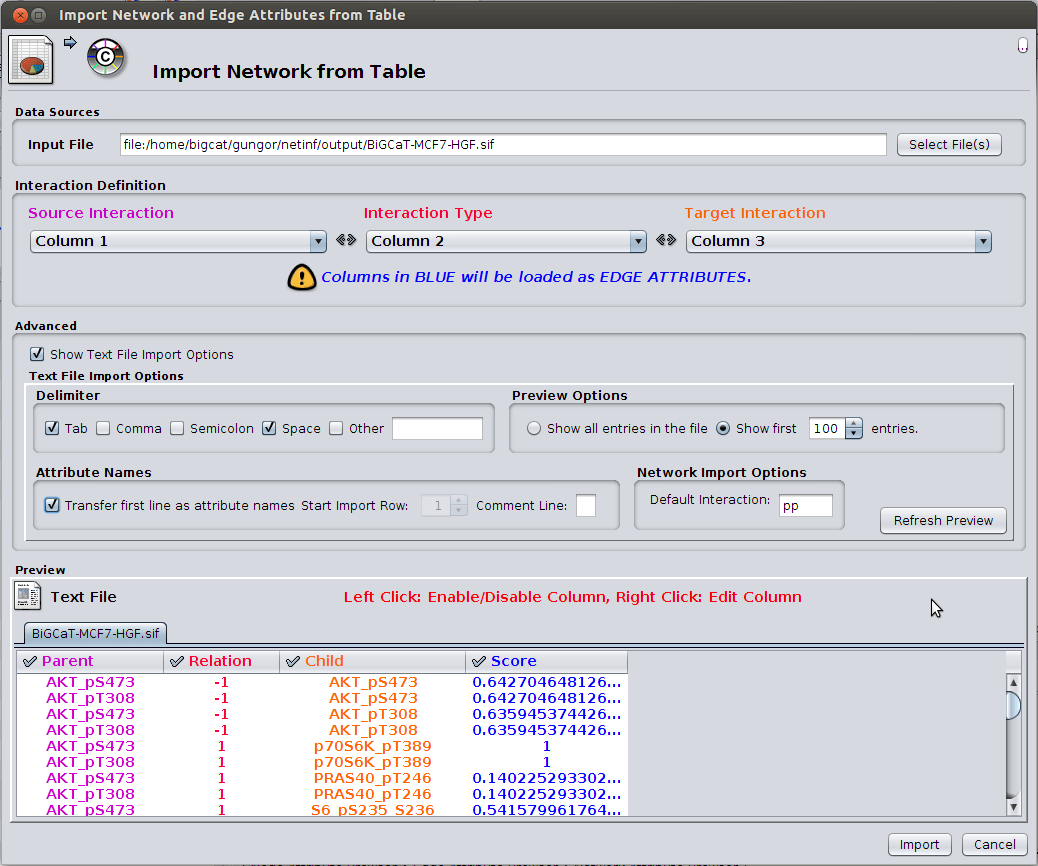
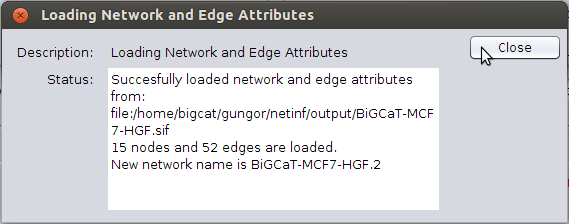
Then, we click on “Import”.
To have a better look of imported network, we can use “Force-directed layout” option. To change the visualization, we go to VizMapper tab of Control Panel on the left. From the list, we select mappings we want to change. Every change will be seen on the next side.
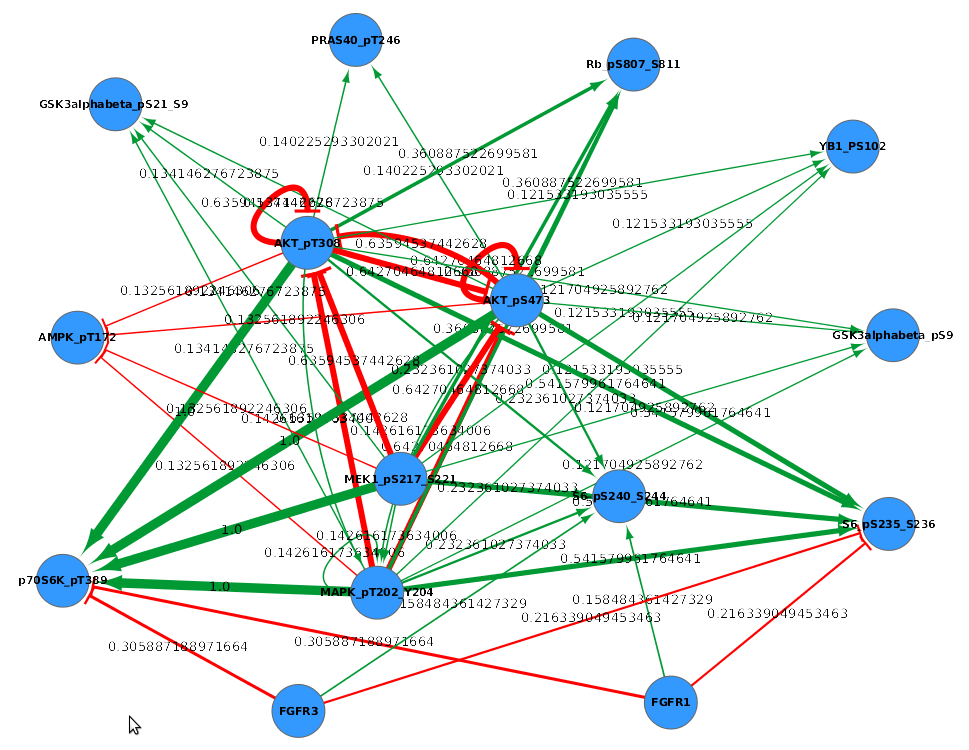
In VizMapper, for each mapping, we define the attribute, and mapping type. Attributes are the columns that we provide in SIF file. There are three mapping types: Continuous, passthrough and discrete mapper. Continuous mapper is used for numbers and provides some kind of gradient look for the mapping. For example, in the example below, edge thickness is done using this option and width is determined by its score. Passthrough mapper puts directly what each row has according to the attribute. Examples are edge scores as edge labels and node names as node labels. In discrete mapper, we select different options for different elements. For example, there are only two relation types and I want “inhibition” (-1) relation to have red colored edge with T-shaped end and “activating” (1) relation to have green colored edge with arrow-shaped end.
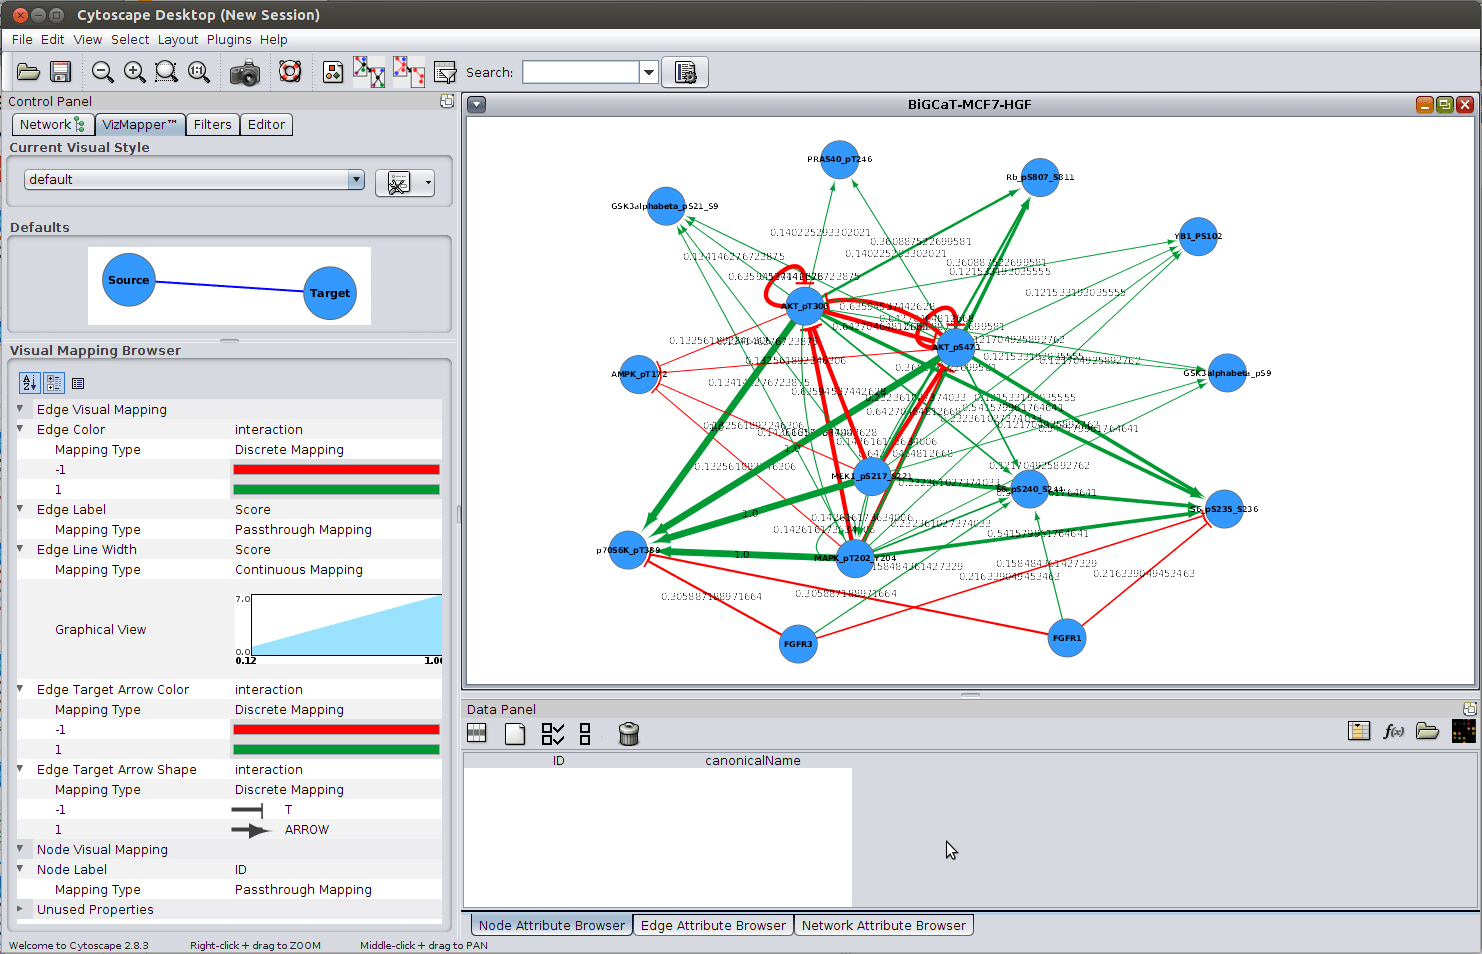
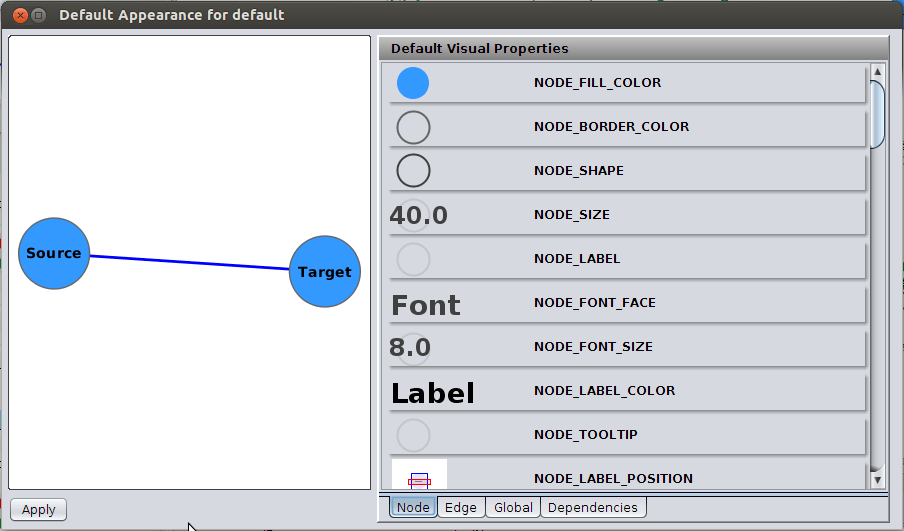
Also, we change “Defaults” from Control Panel for node color, font size, background color.
Below, you can see the result for this network.
“Cytoscape is an open source software platform for visualizing complex networks and integrating these with any type of attribute data.” Find out more on their website.