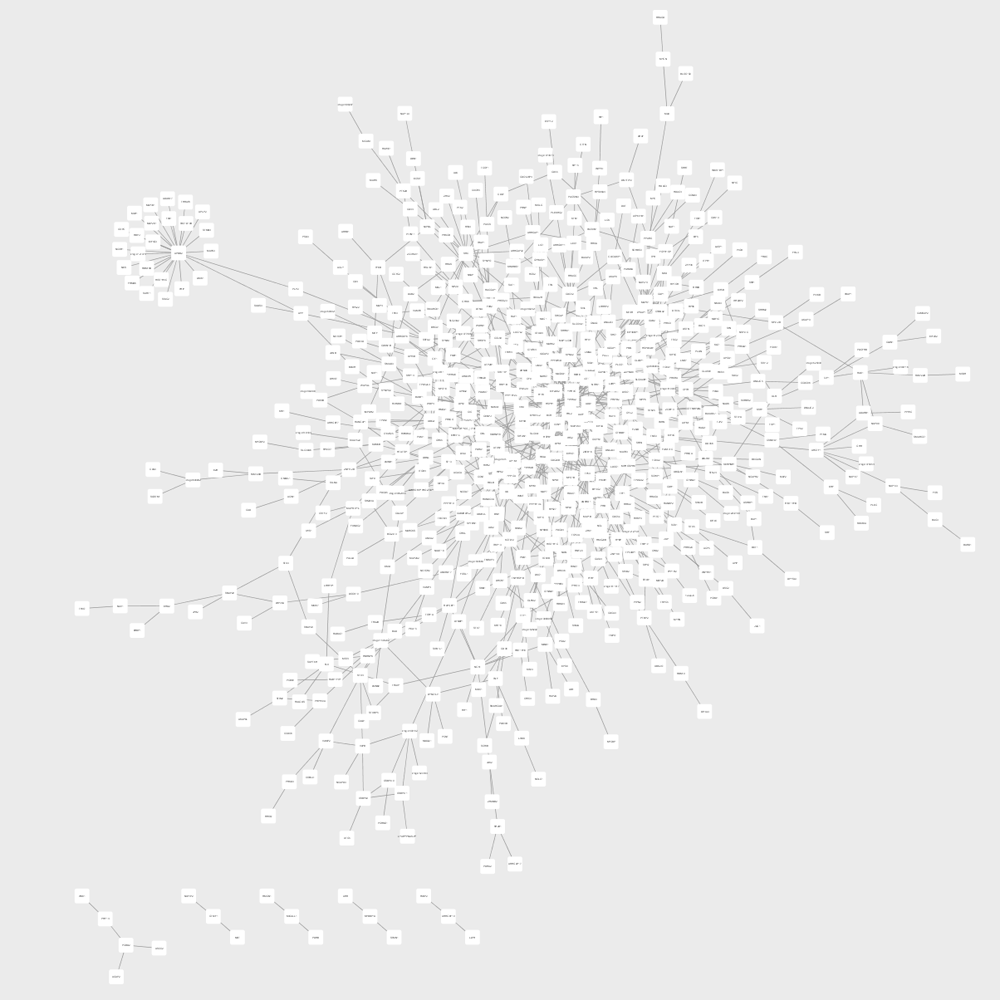
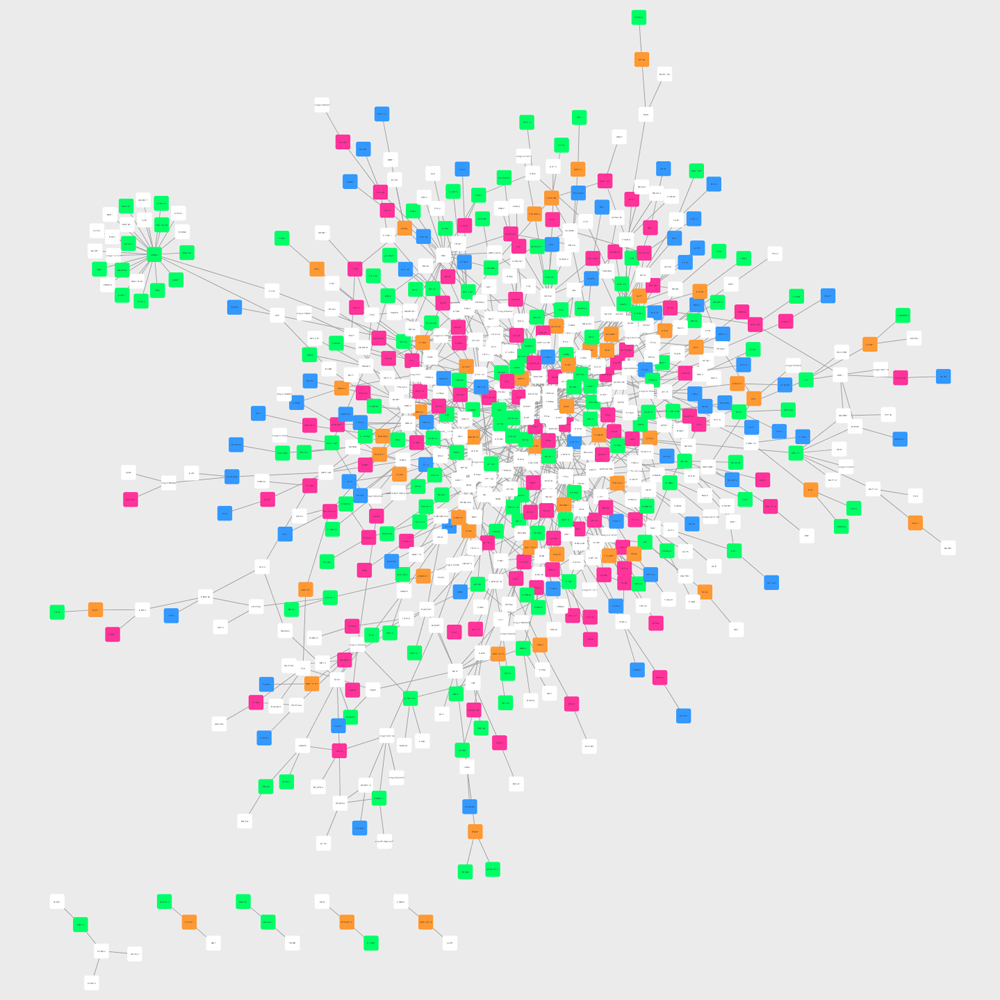
Reconstructed Salmonella Signaling Network Visualized and Colored
By Güngör Budak
- One minute read - 194 wordsAfter fold changes were obtained and HGNC names were found for each phosphopeptide, these were used to construct Salmonella signaling network using PCSF and then with the nodes that PCSF found as well, we generated a matrix which has node in the rows and time points in the columns and each cell shows the presence of corresponding protein under the corresponding time point(s).
The matrix has 658 nodes (proteins) and 4 time points as indicated before: 2 min, 5 min, 10 min and 20 min.
Öykü Eren Özsoy and Tolga Can from METU has developed a method which gets this matrix and an interactome and reconstructs a signaling network. This method enhances the interactions of the nodes in the network. Below, see this network on Cytocape.
Then, to understand which nodes are coming from the data and which of them belong to which time points, I colored the nodes according to a two-column table that has nodes in the first column and their time points in the second column.
Note there are nodes that are seen at multiple time points and in this network they are not specially colored. They will be considered later.

