GO Enrichment of Network Clusters
By Güngör Budak
- One minute read - 160 wordsIn my previous post, I mentioned how I clustered the network we obtained at the end. For functional annotation gene ontology (GO) enrichment has been done on these clusters.
There were 20 clusters and the HGNC names are obtained separately for each cluster and using DAVID functional annotation tool API, GO and pathway annotations are collected per cluster and these are saved separately.
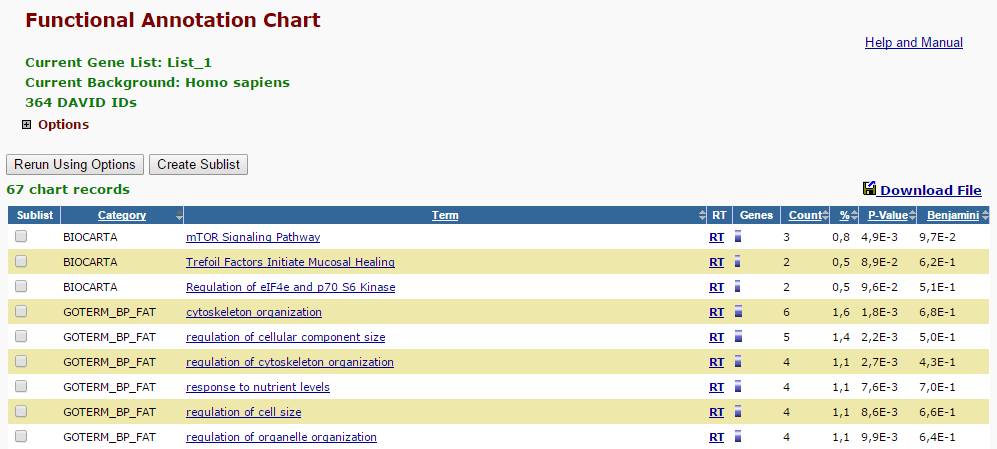
http://david.abcc.ncifcrf.gov/api.jsp?type=OFFICIAL_GENE_SYMBOL&tool=chartReport&annot=GOTERM_BP_FAT,GOTERM_CC_FAT,GOTERM_MF_FAT,BBID,BIOCARTA,KEGG_PATHWAY&ids=HGNC_NAME1,HGNC_NAME2,HGNC_NAME3,...
Above URL was used to obtain chart report for some GO and pathways chart records. “ids” query was changed per cluster with HGNC names coming from each.
Then, downloaded chart reports for each cluster are read and a matrix is created to show p values for each chart record per cluster. The matrix columns are 20 clusters and it has 1344 chart record. If the p value of the chart record in any cluster is smaller than or equal to 0.05, then it’s stored in the corresponding cell, otherwise 0 is written as the p value.